Summary: A figure of merit that enables comparisons between cellular material designs should ideally isolate effects of geometry from composition, especially in the context of the greater design freedom enabled by Additive Manufacturing. In this post I discuss three different metrics that may be used for this purpose and discuss the pros and cons of each.

In a previous post, I defined four questions that a designer needs to address when working with cellular materials. First among these was how a designer would select a cellular material for a specific application. The immediate approach would be to compare the performances of different designs with regard to the properties of interest (such as stiffness or thermal conductivity). But this then begs the question: what is the ideal figure of merit for performing such a comparison?
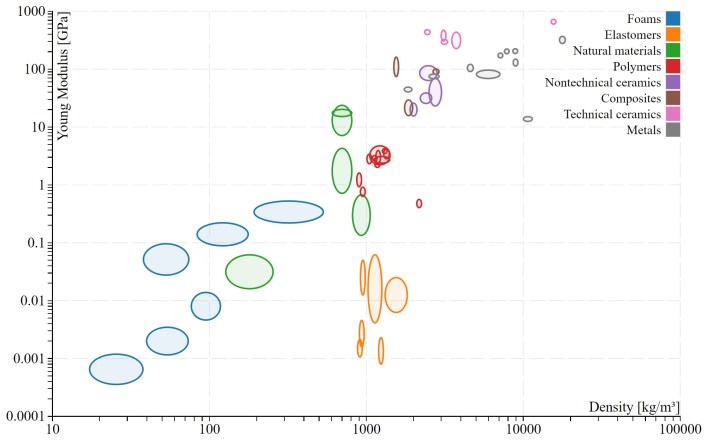
This question is more challenging to answer for cellular materials than may appear at first glance. Consider elastic modulus, for example. For a homogeneous material, one simply looks up a material property chart such as the one shown in Figure 2, and selects a Titanium alloy over an Aluminum one, for example. But this is not as straightforward when it comes to cellular materials, since the observed modulus is a combination of composition (material) and design (cellular structure) and a chart such as the one in Figure 2 provides little granularity regarding the relative contributions of each.
For a designer selecting among several choices of cellular materials (see a prior post on taxonomy of cellular materials), it is thus proper to compare cellular materials by assessing them not just in the context of the property of interest, but to do so in relation to the density (and by extension, mass) of that cellular material. So what is a designer to use to enable such a comparison?
1. Material Indices
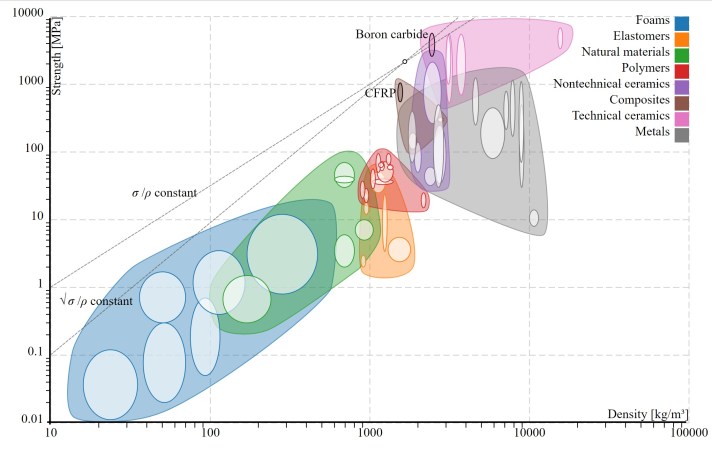
The most well established approach for materials selection involves the concept of a material index that is a function of the structural geometry (tie, beam, column, panel), the objective of interest (weight, cost) and the constraints prescribed (stiffness, strength, buckling load). Given these three pieces of information, a material index can be specified that enables selection among a range of materials. For strength-limited designs for example, with the objective of minimizing mass, the index becomes:
σy/ρ for a tie structure
(σy)0.5/ρ for a panel structure
where σy is the yield strength, and ρ is the density of the material. So we would seek materials that maximize these indices – and select the highest available (all other things being equal). For cellular materials, these indices would be composed of “effective properties” but otherwise the process is identical (cellular materials are said to have effective properties to distinguish them from bulk properties: an effective property is not attributable to material composition alone, it is also influenced by design).
A convenient visualization is obtained by plotting lines with constant index values on the Ashby plot (only when represented as a log-log plot), as shown in Figure 3. Materials lying on this line thus have the same index value. These ideas are developed in chapter 5 of Ashby’s classic text, “Materials Selection in Mechanical Design” and are not discussed in more detail here.
Since this method leverages effective properties of the cellular material, it does not enable an isolation of geometry from composition, as we are seeking to do. Additionally, the underlying methodology to deriving these indices assumes isotropic behavior, at least in its popular manifestations (though this is not a requirement in principle) – which is a limiting constraint for the majority of cellular materials. The material index may thus not be appropriate for comparing cellular material behavior – though I admit to having seen no evidence either way, and state this as a matter of opinion. A final critique of the indices, perhaps only of academic interest, is that they can lack physical insight and possess unfamiliar units that are sometimes difficult to interpret, depending on the specific index under consideration.
2. The Relative Effective Property
While material indices are a powerful method of material selection, their use for cellular materials can obfuscate the design detail we are interested in. We thus turn our attention to a dimensionless metric that we may call simply as the relative property. In the context of cellular materials, we would state this more precisely as the relative effective property.
A relative effective property is simply expressed as the effective property of interest divided (normalized) by the same property but for the material that constitutes the cellular structure. So, to cite one example, instead of comparing just the effective moduli E* of two cellular materials, we would compare their relative effective moduli:
Relative Effective Modulus = E*/Es
where Es represents the effective modulus of the solid material from which the cellular material is composed.
Normalizing the property we are seeking to maximize (or minimize) by its equivalent bulk material property allows us to isolate contributions of composition. The benefit of doing this is clear in Figure 4, where the effective modulii of three different regular honeycomb geometries are compared, independent of the modulus of the material this was composed of. (This graph is for a specific ratio of thickness (t) over length (l), which are geometric parameters associated with the honeycomb). Additionally, since the property is explicitly included in the metric itself, we can specify it with respect to direction, enabling the polar plot of Figure 4. While this plot is generated using analytical results, similar data can be developed numerically or experimentally as well.

A disadvantage of using the relative effective property is that it does not address the material utilization (density) aspects in the figure of merit itself. For example, we may choose to pick the triangular honeycomb on the basis of Figure 3 as our stiffest material, but is it the optimum utilization of material to achieve the modulus desired? For that we need to have a metric that includes the benefits of normalization but combines it with a consideration of relative density.
3. The Geometric Efficiency Index
Berger et al. (2017) used a term to address the shortcomings discussed previously. They describe this term as a measure of geometric efficiency of the cellular material design, which is independent of the composition of the material used to create it. For effective modulus of a cellular material, for example, the geometric efficiency index is:

where E* and ρ* represent the effective modulus and density of the cellular material whereas Es and ρs represent their bulk counterparts.
The power of such a metric is it allows a designer to answer a question such as what is the stiffest isotropic cellular material design? Traditionally, in material selection handbooks, this answer can be obtained by a study of plots of modulus vs density, where material indices are prescribed depending on the objective and constraint of interest. However, as mentioned previously, this approach does not isolate the contributions of material from geometry. Berger et al. examined different metamaterials with the aim of identifying ones near the theoretical limit for elastic stiffness. Under the specific constraint of isotropy, and for the structures they examined, they found that the “cubic-octet foam” structure (shown in Figure 5) was the isotropic metamaterial with the highest stiffness and approached the theoretical maximum (given by the so-called Hashin-Shtrikman upper bound). The authors also drew additional insight from the study comparing different shapes, to quote: “We find that stiff but well distributed networks of plates are required to transfer loads efficiently between neighboring members.”

An empirical approach thus enables meaningful comparisons between cellular materials – this is true even beyond the measure of stiffness cited above, which looked at the question for shear and bulk modulus as well. Other studies have compared different cellular materials for their yield strengths and thermal conductivity. In principle, any property amenable to evaluation through computational and/or experimental techniques can thus be subjected to evaluation in the context of cellular materials and prove to be of vital importance to the designer seeking to achieve a certain performance objective.
Caveats
Before one heads off to design every stiffness- and weight-critical structure with cubic octet foams, it is important to remember that selection of the unit cell based on any of the aforementioned figures of merit is not sufficient. This is for (at least) two reasons:
- As mentioned at the start of the post, selecting a unit cell design is only one of four decisions a designer needs to make. In a previous post, I developed the other three: cell size and its distribution, cell parameter optimization and structural integration. It is not evident that the selection of a unit cell is always the most critical of these four decisions (more on this in a future post).
- A second, more subtle reason, is with regard to the translation of effective properties estimated under relatively simple loading conditions into structural, component level behavior. The reason material indices (the first of the three metrics discussed here) are powerful is because they seek to address the specific geometry, loading condition and objective, in arriving at an index. This is not the case for the other two indices. A beam full of unit cells, under bending, is experiencing a more complex state of stress distribution than is seen in the generation of effective properties, where all cells experience the same state of stress (even assuming size effects are accounted for).
In conclusion, cellular material selection through indices is an important step, but it is just the first of many decisions in the design process. Additionally, there are other ways to select a cellular material that do not rely on such indices and the underlying empirical methods used to arrive at them – I shall return to these in future posts.
~
Thank you for reading! If this topic was of interest to you, please follow me on Linked In and/or Twitter to ensure you don’t miss future posts.
